Challenge
| Link | Difficulty | Status |
|---|---|---|
| https://play.picoctf.org/practice/challenge/476?category=1&originalEvent=74&page=1 |  |  |
Note
Description
Welcome to the challenge! In this challenge, you will explore a web application and find an endpoint that exposes a file containing a hidden flag. The application is a simple blog website where you can read articles about various topics, including an article about API Documentation. Your goal is to explore the application and find the endpoint that generates files holding the server’s memory, where a secret flag is hidden.
Additional details will be available after launching your challenge instance.
Solution
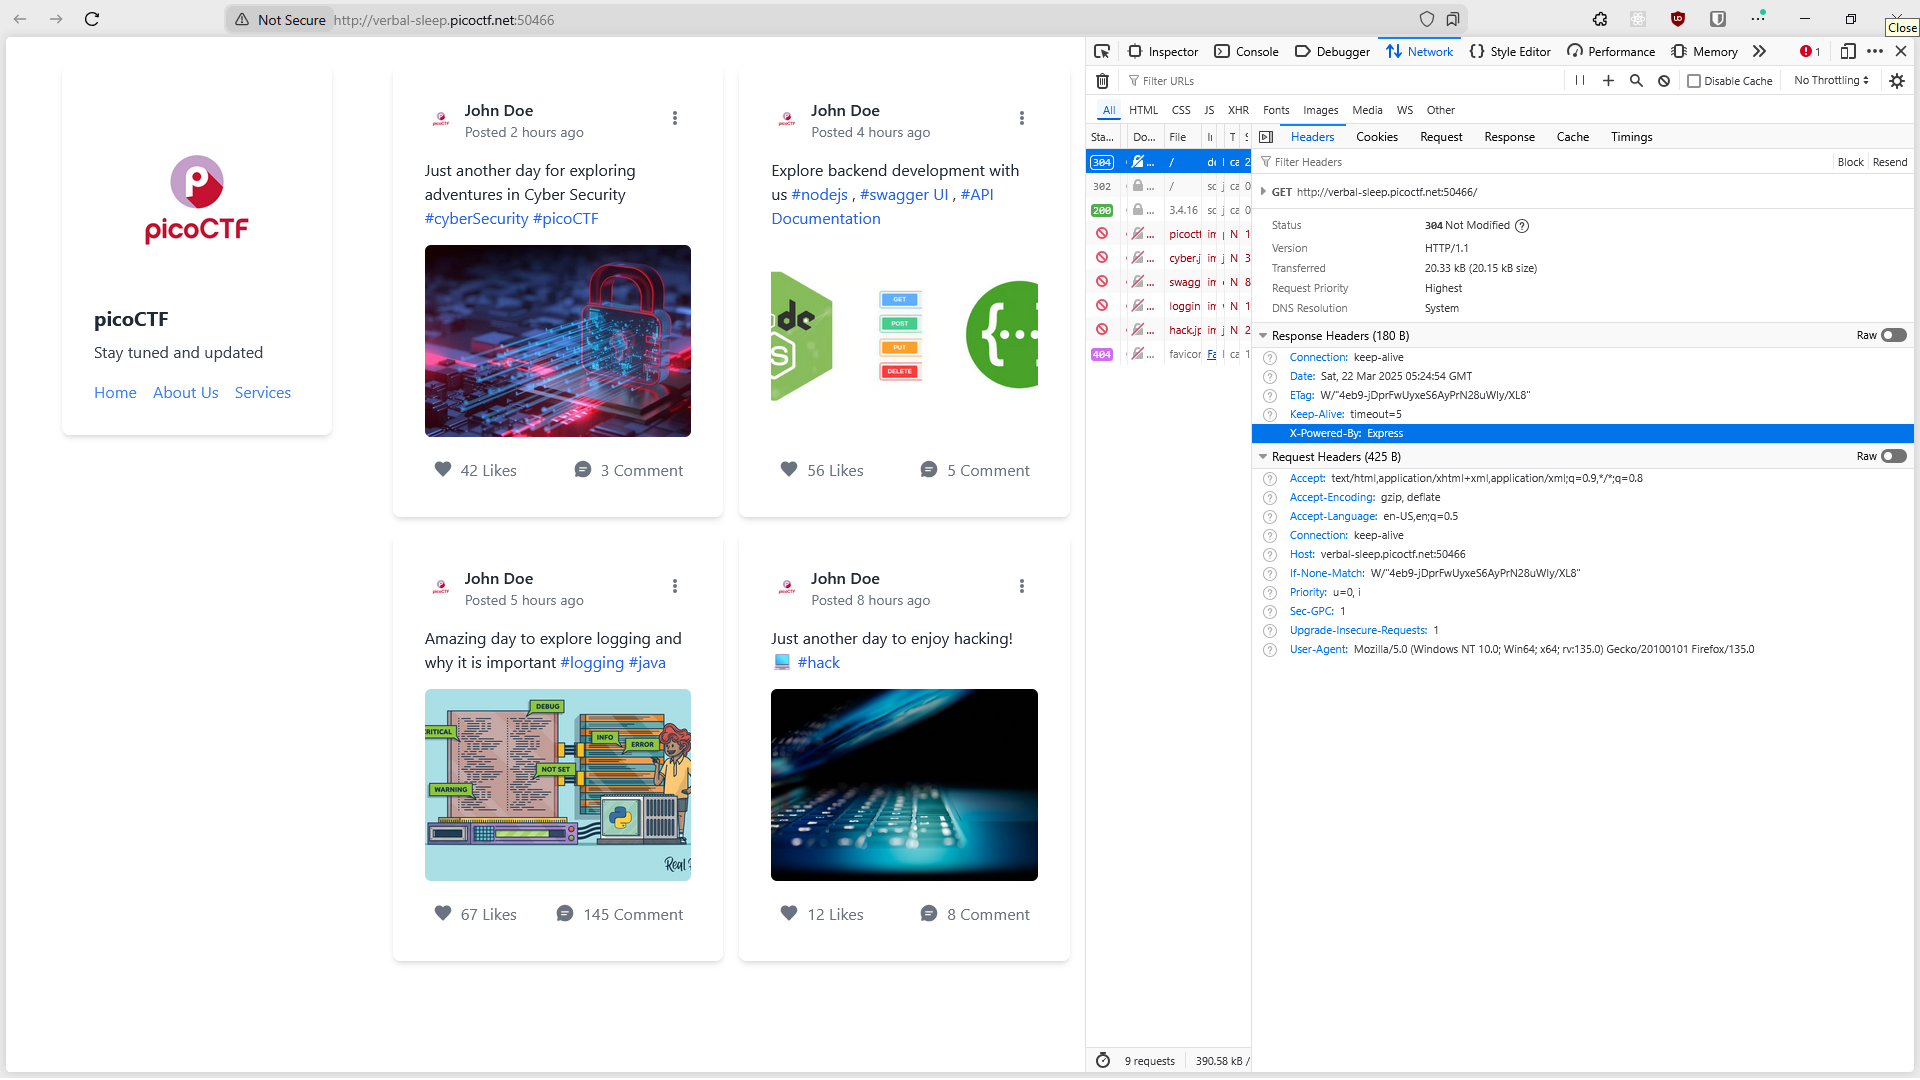
Launching the challenge opens up a blog website. If we look at the Description of the challenge they mention one article in particular, an article on API Documentation. As can be seen in the image below it looks like it talks about Express JS(NodeJS web application framework ) and Swagger (tool used to document your api’s).
 We can check if this website is based on Express by quickly checking the response headers. Now there is a high chance that this site has Swagger integrated and finding it could reveal all the documented endpoints. One of the endpoints could be exploited to find our flag as mentioned in the description.
A quick google search on express swagger lands you on the npmjs.com(NodeJS package repository) page https://www.npmjs.com/package/swagger-ui-express. Skimming through the documentation on this page reveals an example in which the endpoint /api-docs where swagger is being served.
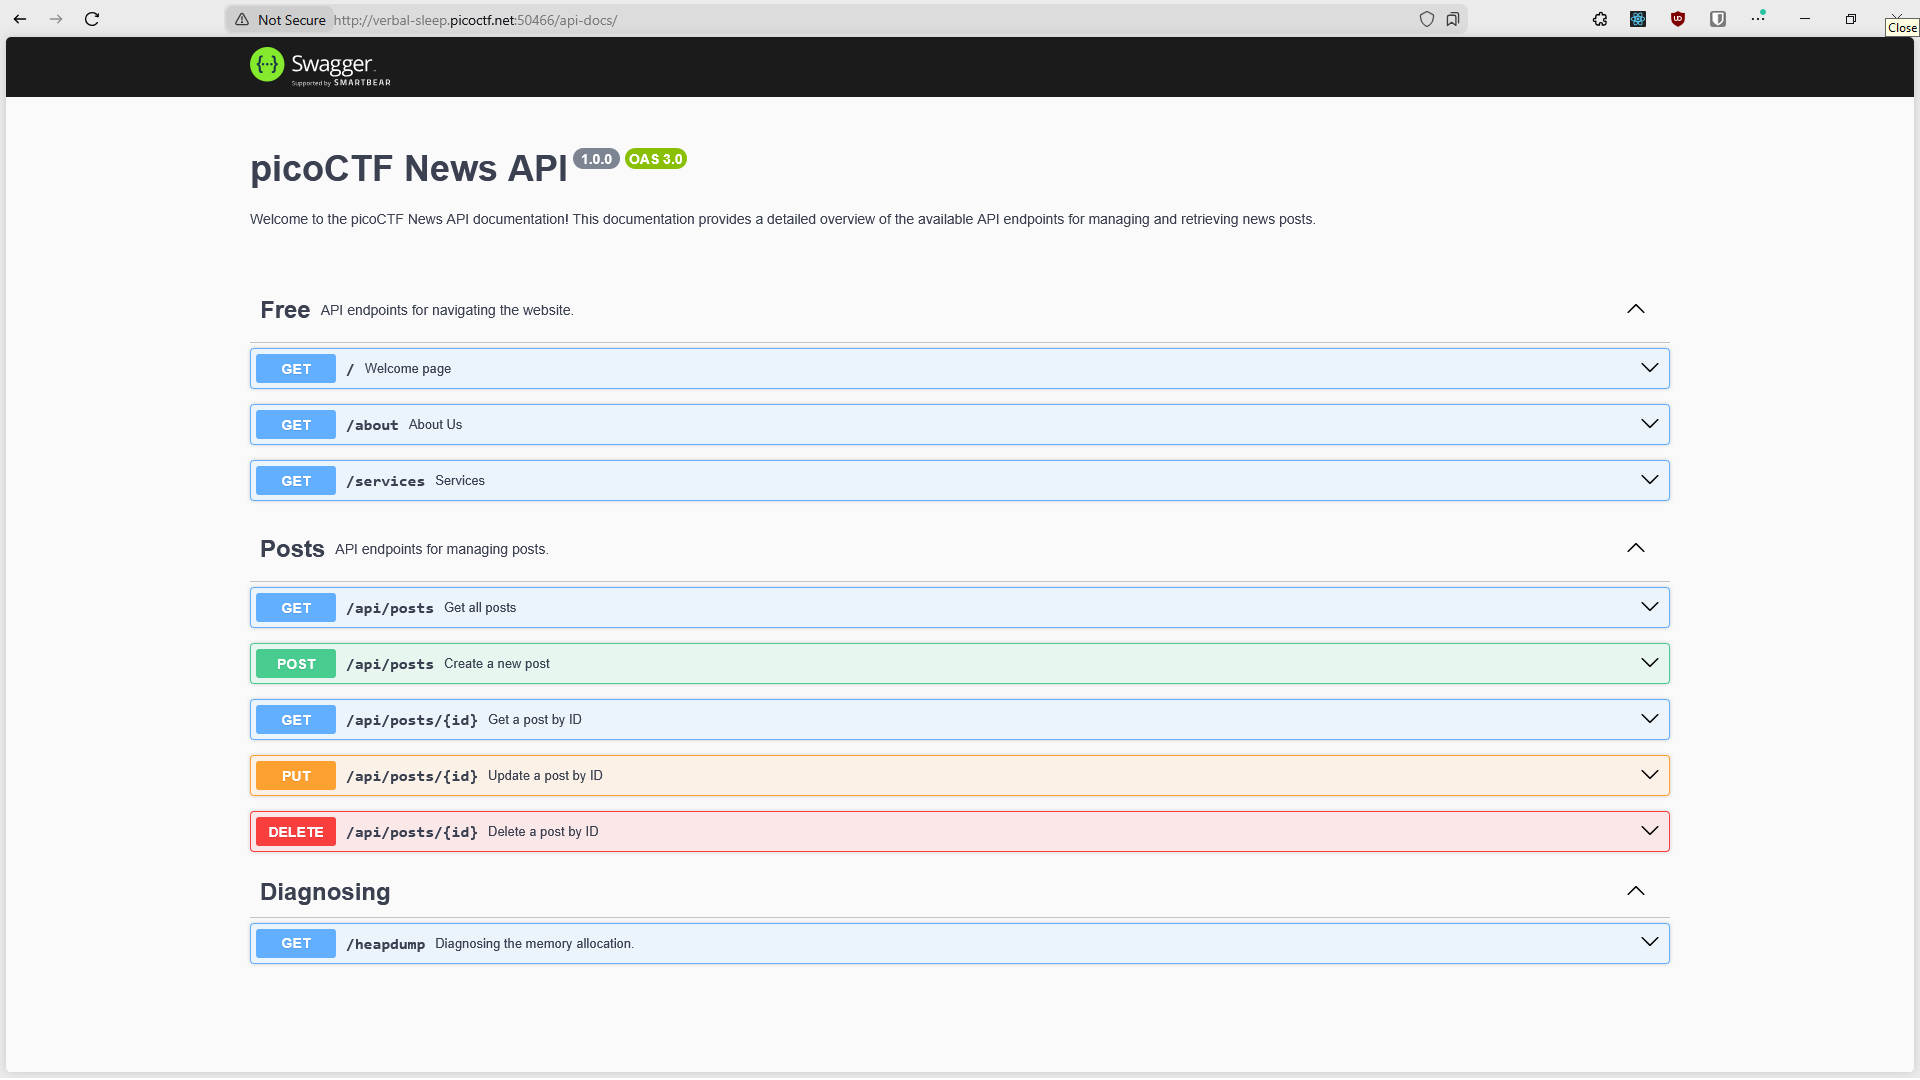
app.use('/api-docs', swaggerUi.serve, swaggerUi.setup(swaggerDocument));Trying to see if this website is using the same endpoint and it opens up the Swagger UI.
 As mentioned in the description, there is indeed an endpoint exposed to download the memory snapshot. You can expand the endpoint and try to invoke it right from the Swagger UI and you can download the snapshot file from the response body.
Google chrome has a memory tab in it’s devtools which can be used to analyze memory snapshots but I had no luck opening it successfully, every time i tried to open it it ended up in an error.
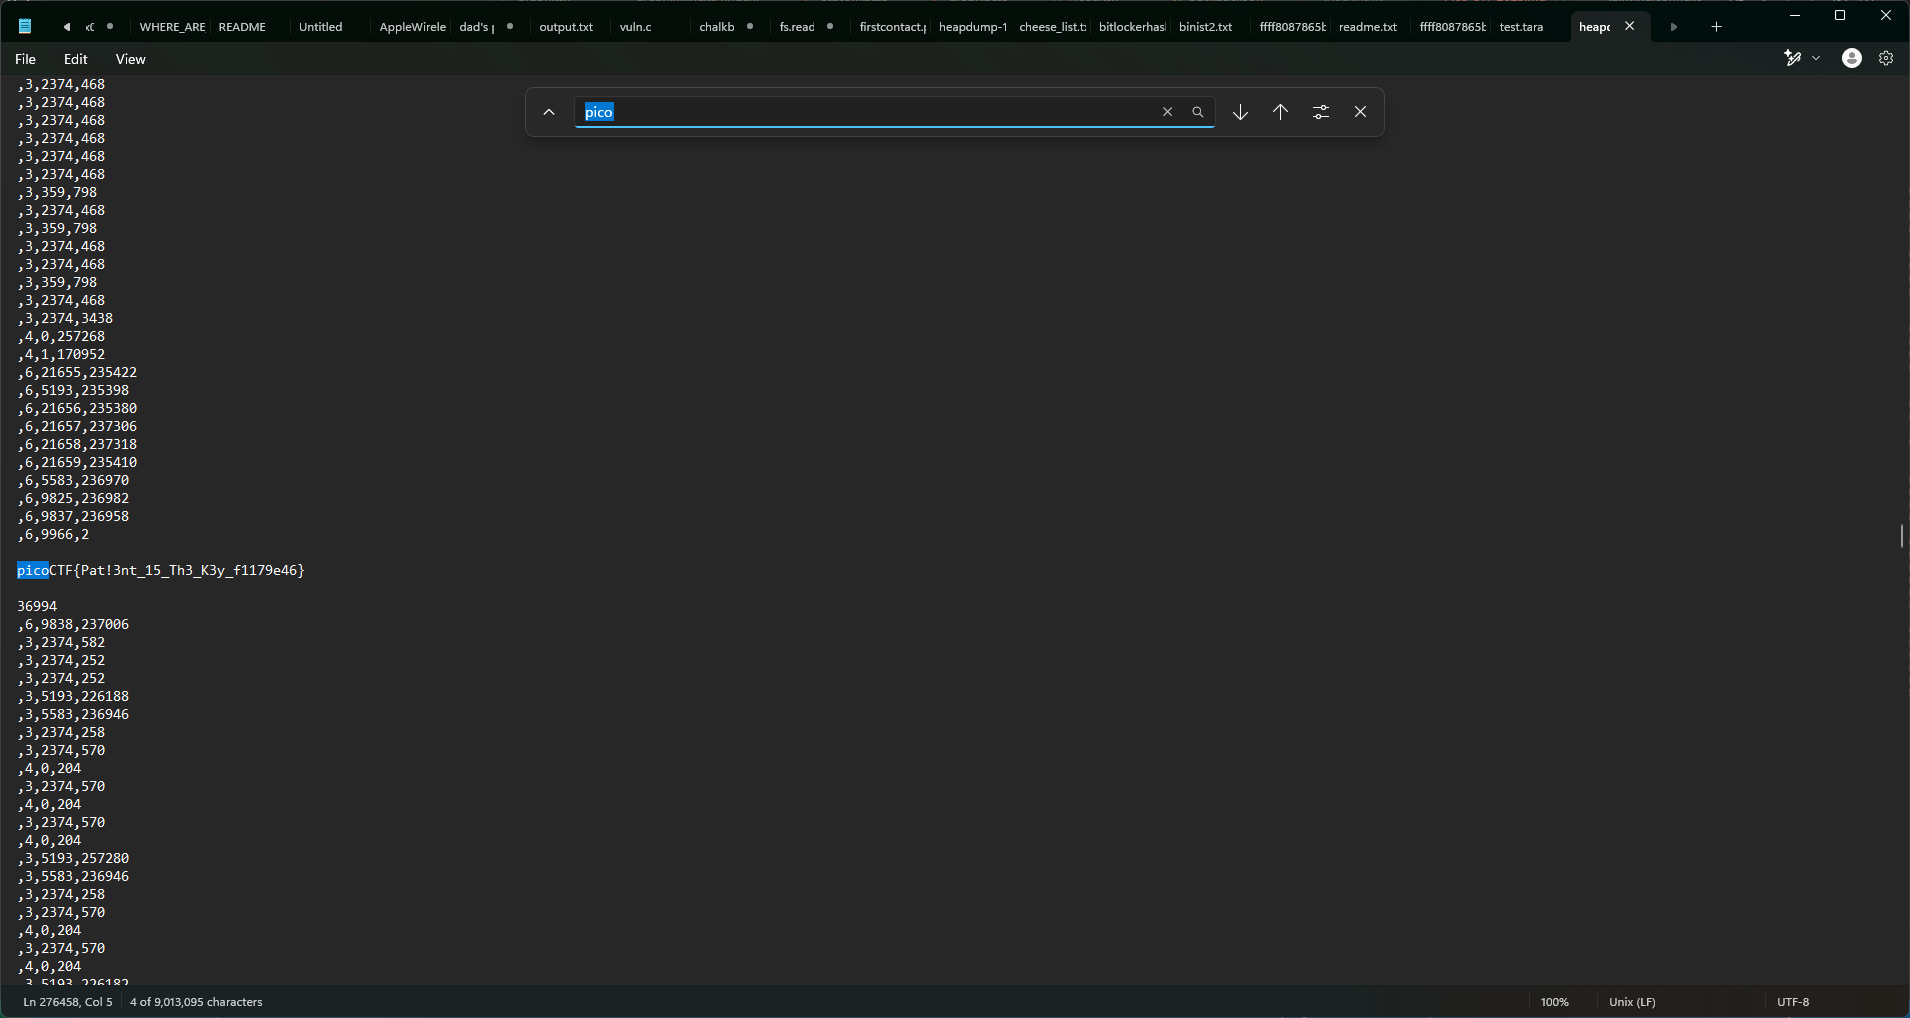
Finally I tried to open it as a text file and look through the contents and search for the flag.

Something I realized while writing this write up was that the link to SwaggerUI was right there on the page. That article talking about API Documentation has a link called Documentation which points to Swagger UI.